Skip to main content
- Out of the 111 cities ranked, Chennai stood 14th in the overall ranking with a score of 47.24
- This was much higher than the national average (35.64)
- The overall rank 1 was bagged by Pune with a score of 58.11
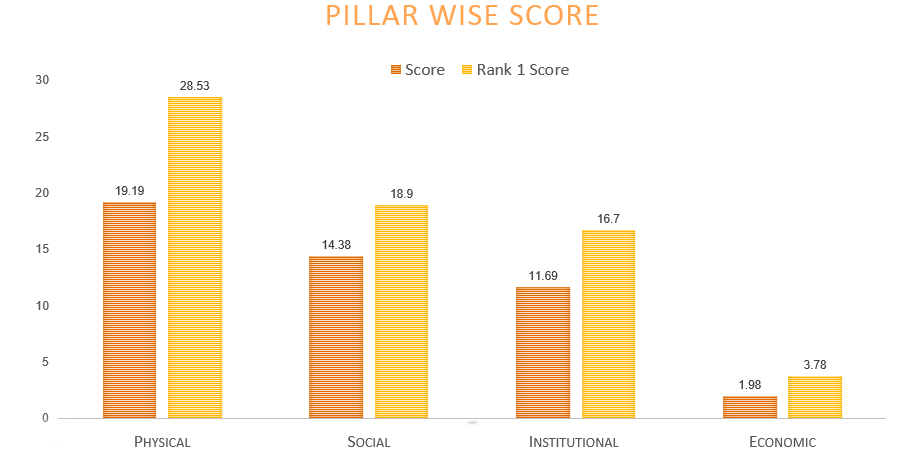
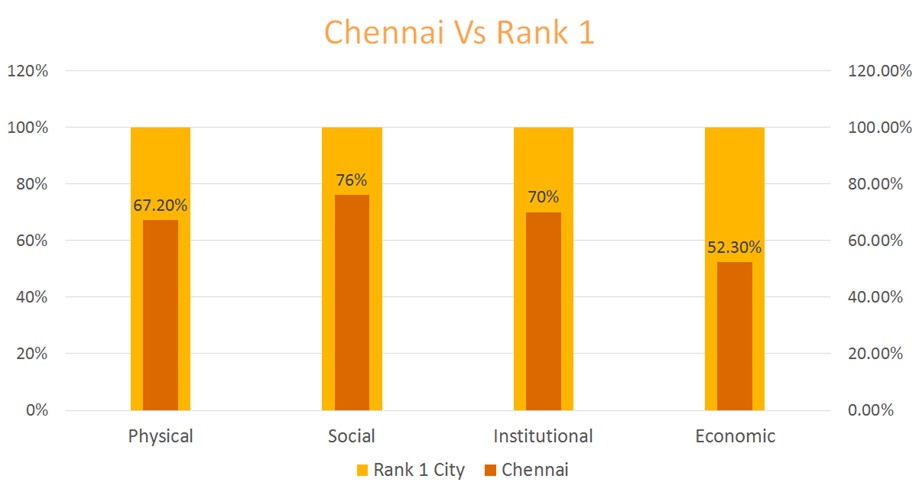
- If the respective rank 1 scores are considered as benchmark (100%), the highest gap exists in economic pillar, where the gap is almost double (47.70%)
- The gap is 32% in physical infrastructure, 30% in institutional infrastructure and 24% in social infrastructure.
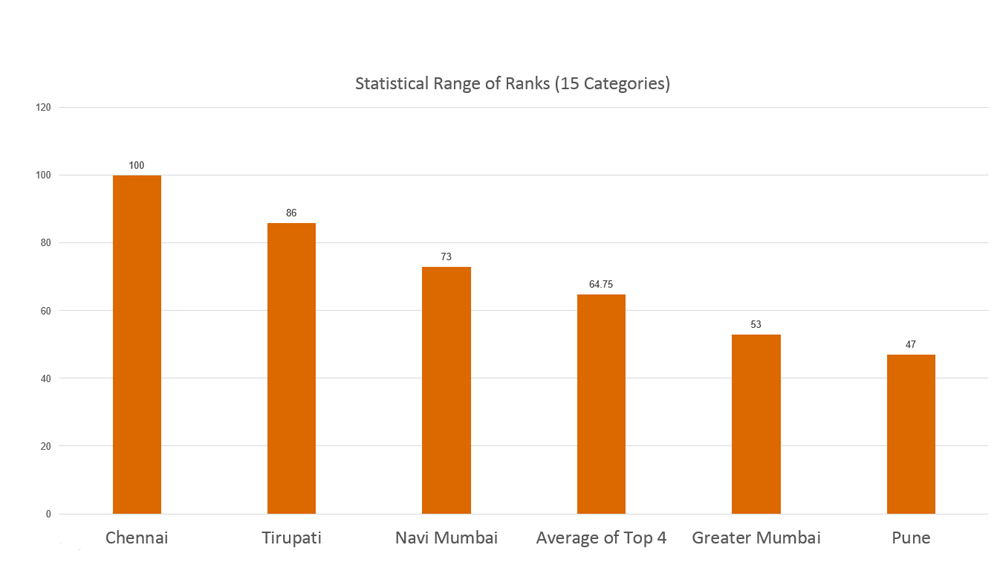
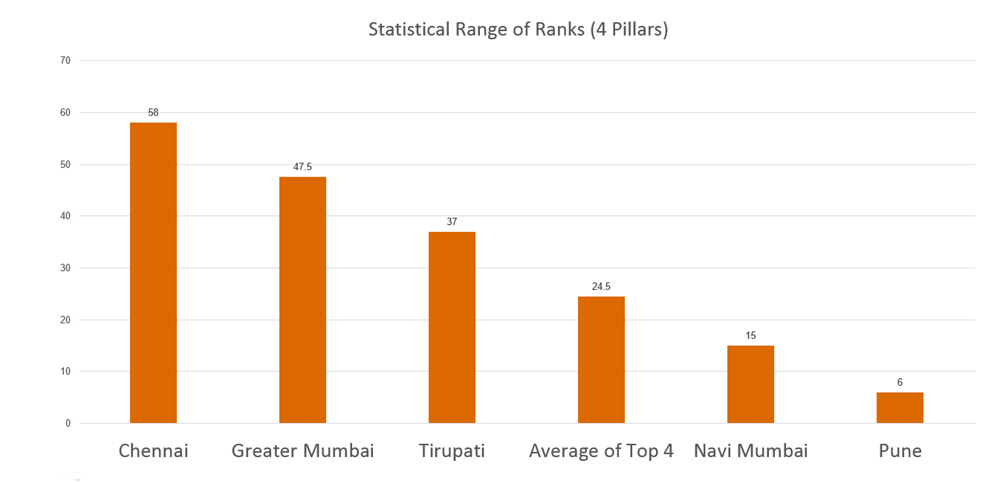
- A statistical range is defined as the highest value minus the lowest value obtained in a set
- In simple terms it explains the amount of variability, volatility or lack of a consistent performance. The higher the range, more the inconsistency.
- It is observed that the range of Chennai city is much higher than the top 4 and their average in both the pillar level and category level.
- This means, the gap between the best rank and worst rank is very high, indicating a need to score more consistently.
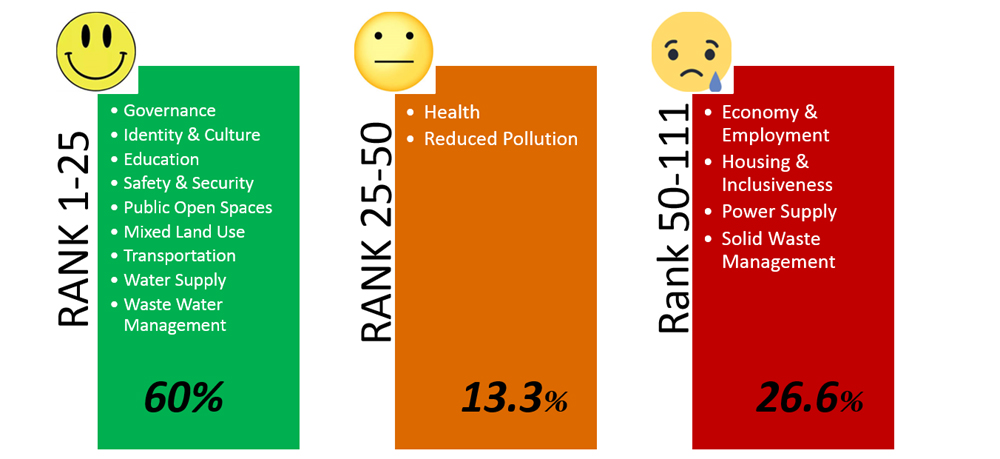
- Lowest ranks for Chennai are obtained by the Economic Pillar and Power Supply Category in their respective levels.